
Understanding Price Per Square Foot: A Key metric to Evaluating Neighborhood Value
Miami-Dade County’s waterfront property market is as diverse as its neighborhoods, offering unique opportunities for investors. In this blog, I introduce price per square foot as a key metric to analyze market performance. By grouping waterfront properties within their respective neighborhoods and examining historical trends, investors can uncover valuable insights into past market dynamics. This data-driven approach not only highlights each neighborhood’s unique trajectory but also equips investors with the tools to make informed decisions about future opportunities.
Price per square foot is a widely used metric in real estate, providing a straightforward way to evaluate and compare properties. However, its reliability is strongest when applied to homes in a localized area like a neighborhood. Properties in similar areas often share comparable amenities, architectural styles, and market dynamics, making price per square foot a valuable tool for estimating the value of a home relative to its neighbors.
The age of a property also has a significant impact on its price per square foot. Older homes may offer charm and character, but they often require renovations or upgrades to align with modern standards, which can lower their perceived value in terms of price per square foot. Conversely, newer properties typically demand a premium because they offer updated designs, energy-efficient systems, and the latest amenities. In rapidly evolving neighborhoods, the age of a home can play a crucial role in how buyers assess its value compared to nearby properties.
By combining this metric with a deeper analysis of a property’s specific features and its market context, buyers and sellers can arrive at a more accurate and tailored assessment of value for a particular property.
Within Miami-Dade County, the diversity of neighborhoods offers a wealth of opportunities for analysis. For this blog, however, I will focus on neighborhoods where Sunland Group has undertaken development projects, Belmar, Belle Meade, Coral Gables and we will also investigate the greater Miami Dade county as a reference to the market. By conducting a historical analysis of these areas, I aim to illustrate their performance over time.
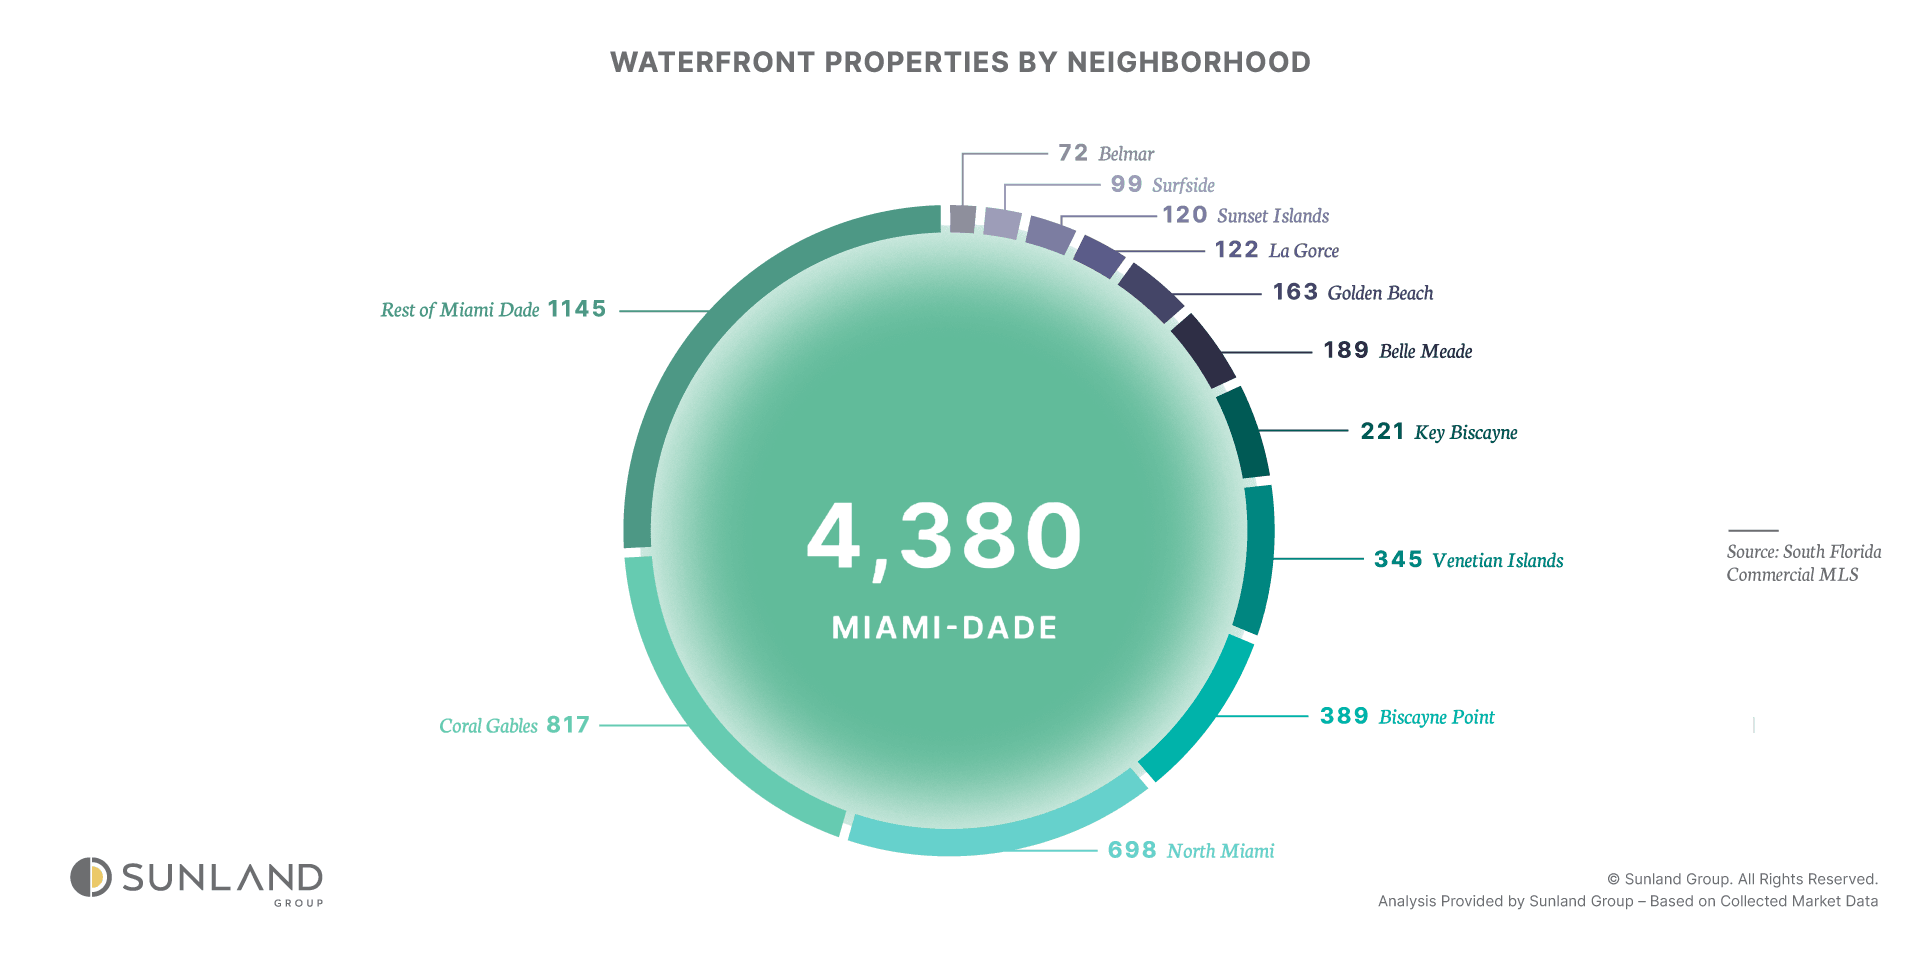
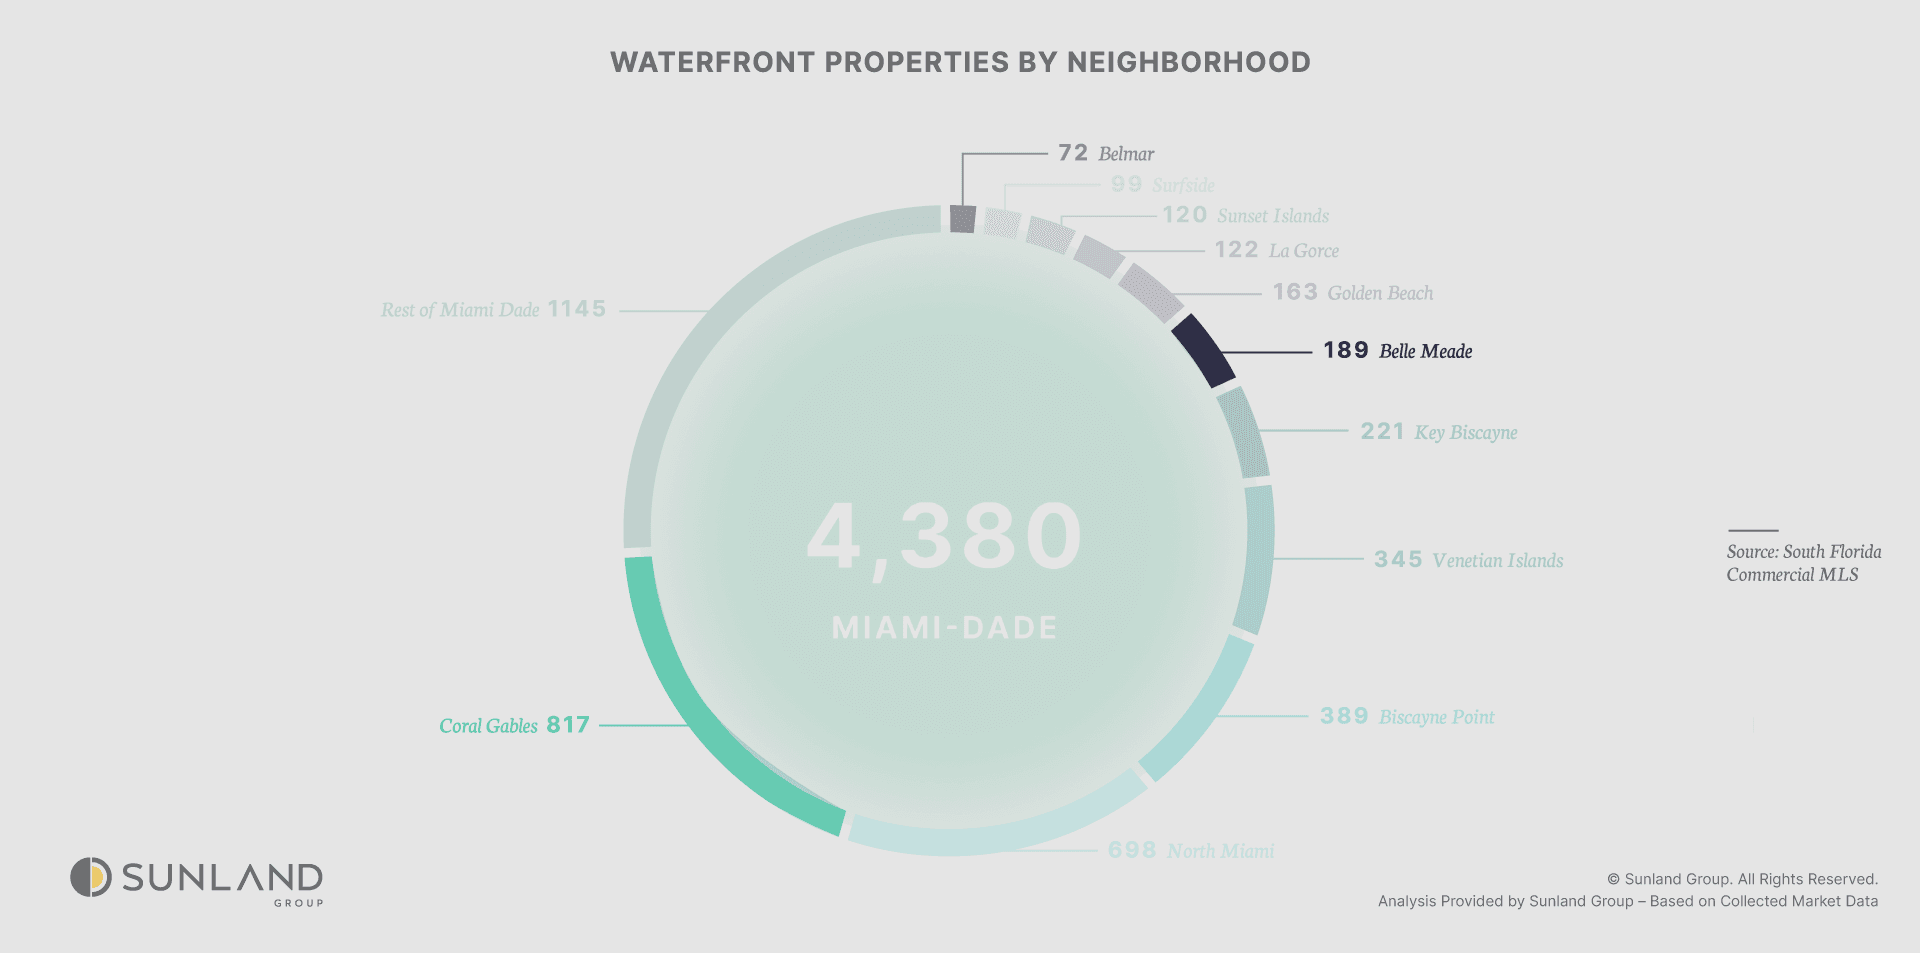
Before diving into historical pricing, it’s essential to first understand the distribution of waterfront properties across these neighborhoods and their contribution to the countywide market. The number of properties within each neighborhood provides valuable context for interpreting pricing trends, as it directly influences market activity, sales volume, and pricing stability. By examining the share of waterfront properties in each neighborhood, we can better assess their relative impact on the overall Miami-Dade County market before analyzing historical price trends.
BELMAR, BELLE MEADE & CORAL GABLES
Among the neighborhoods analyzed, Belmar stands out due to its relatively small number of waterfront properties. This smaller inventory introduces greater volatility in its historical pricing data. Because of the small number we will look at the historical pricing data over half year increments.
Another critical factor influencing pricing trends is the average size of homes in these neighborhoods. Larger homes tend to have higher prices, which can significantly affect market dynamics. Within the 3 neighborhoods that we are investigating, Coral Gables has the largest houses with an average area of 5,400sqft followed by Belle Meade at 3,600, and Belmar at 3,100. To put these numbers in perspective, Miami’s median home size is approximately 2,000sqft, according to storagecafe.com. This size difference highlights the premium nature of these neighborhoods, further setting the stage for analyzing historical pricing trends.
With this foundational understanding of neighborhood distribution and home size, we can now explore historical pricing trends to gain deeper insights into how values have evolved over time. By accounting for variability in neighborhoods like Belmar and contextualizing trends with factors like home size, we can derive a nuanced understanding of waterfront property dynamics in Miami-Dade County.
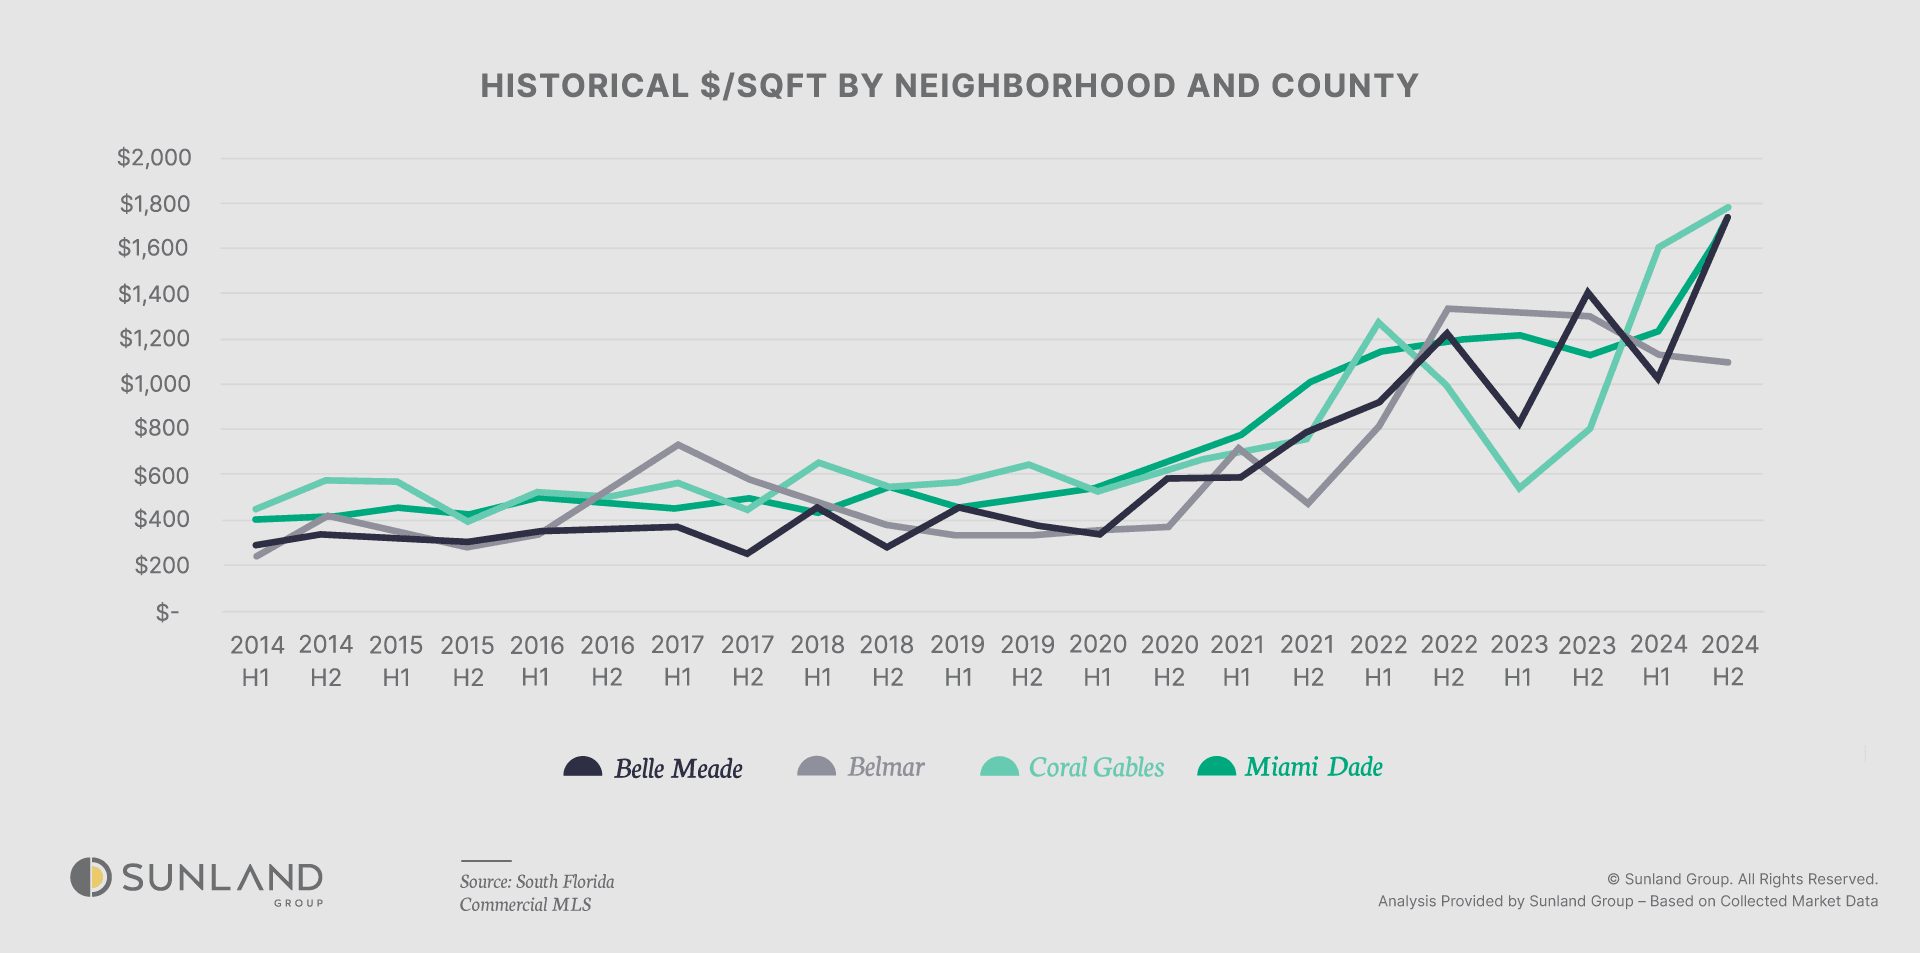
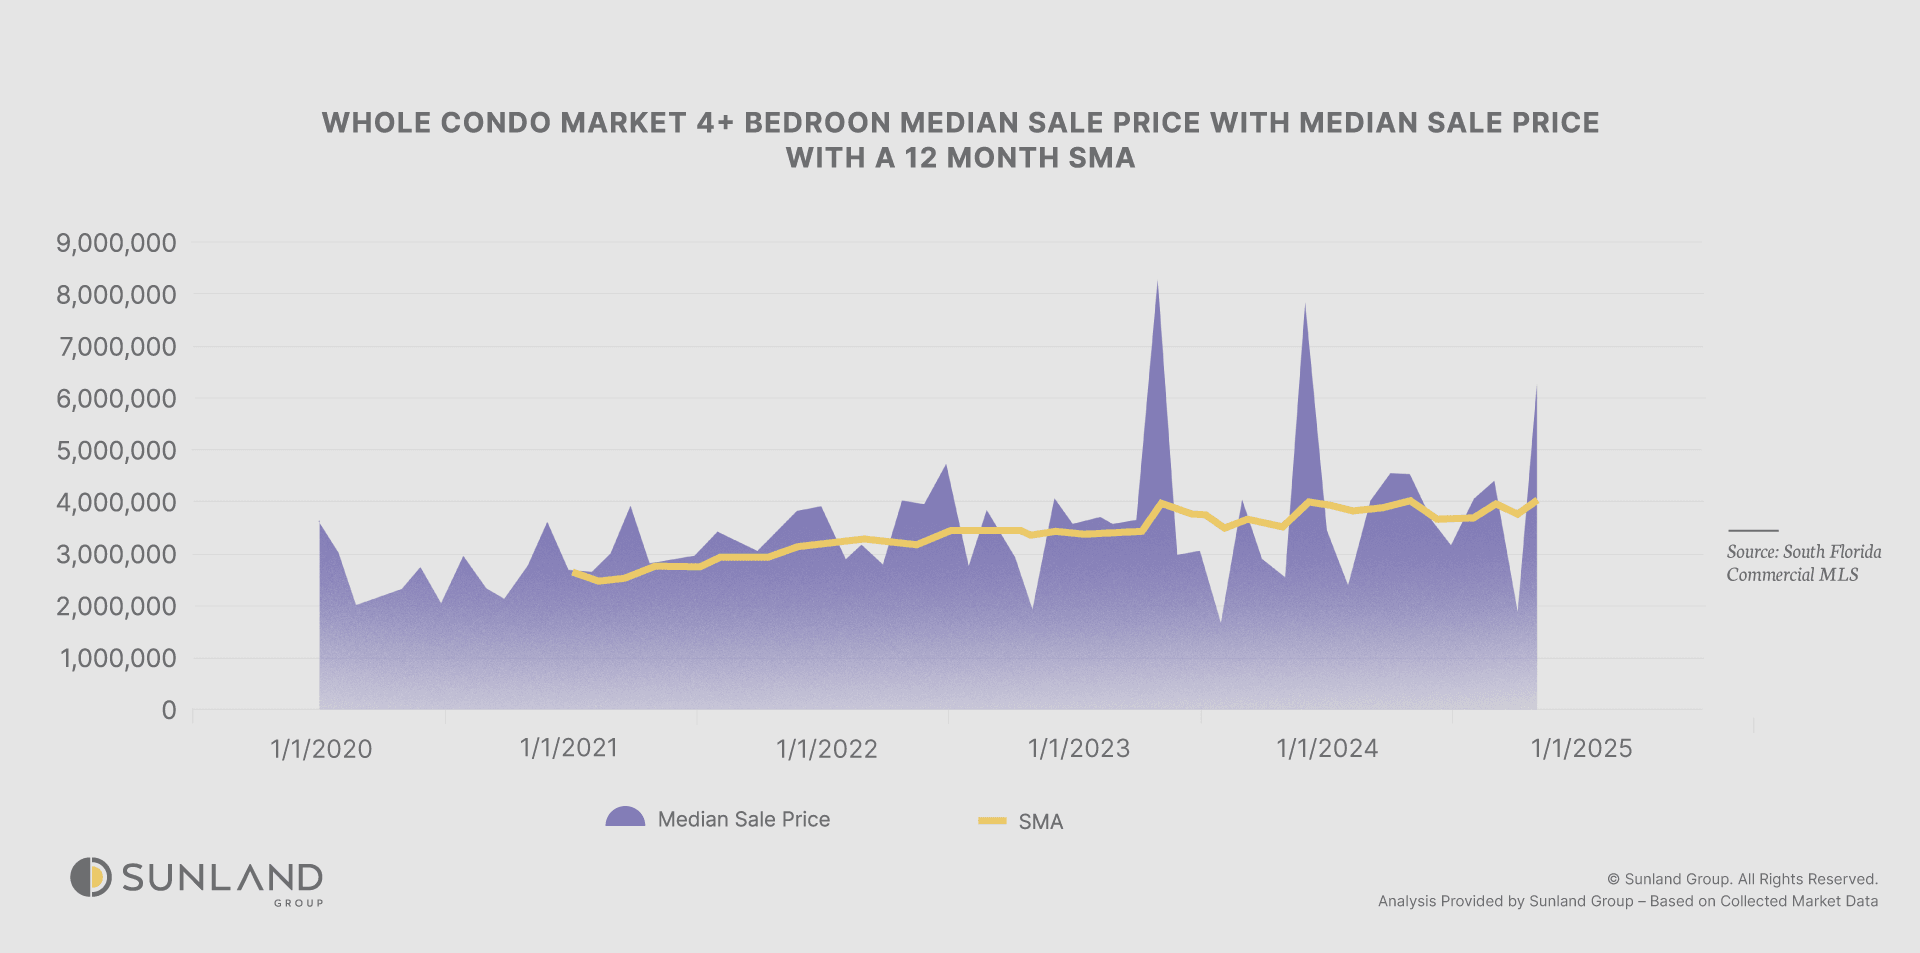
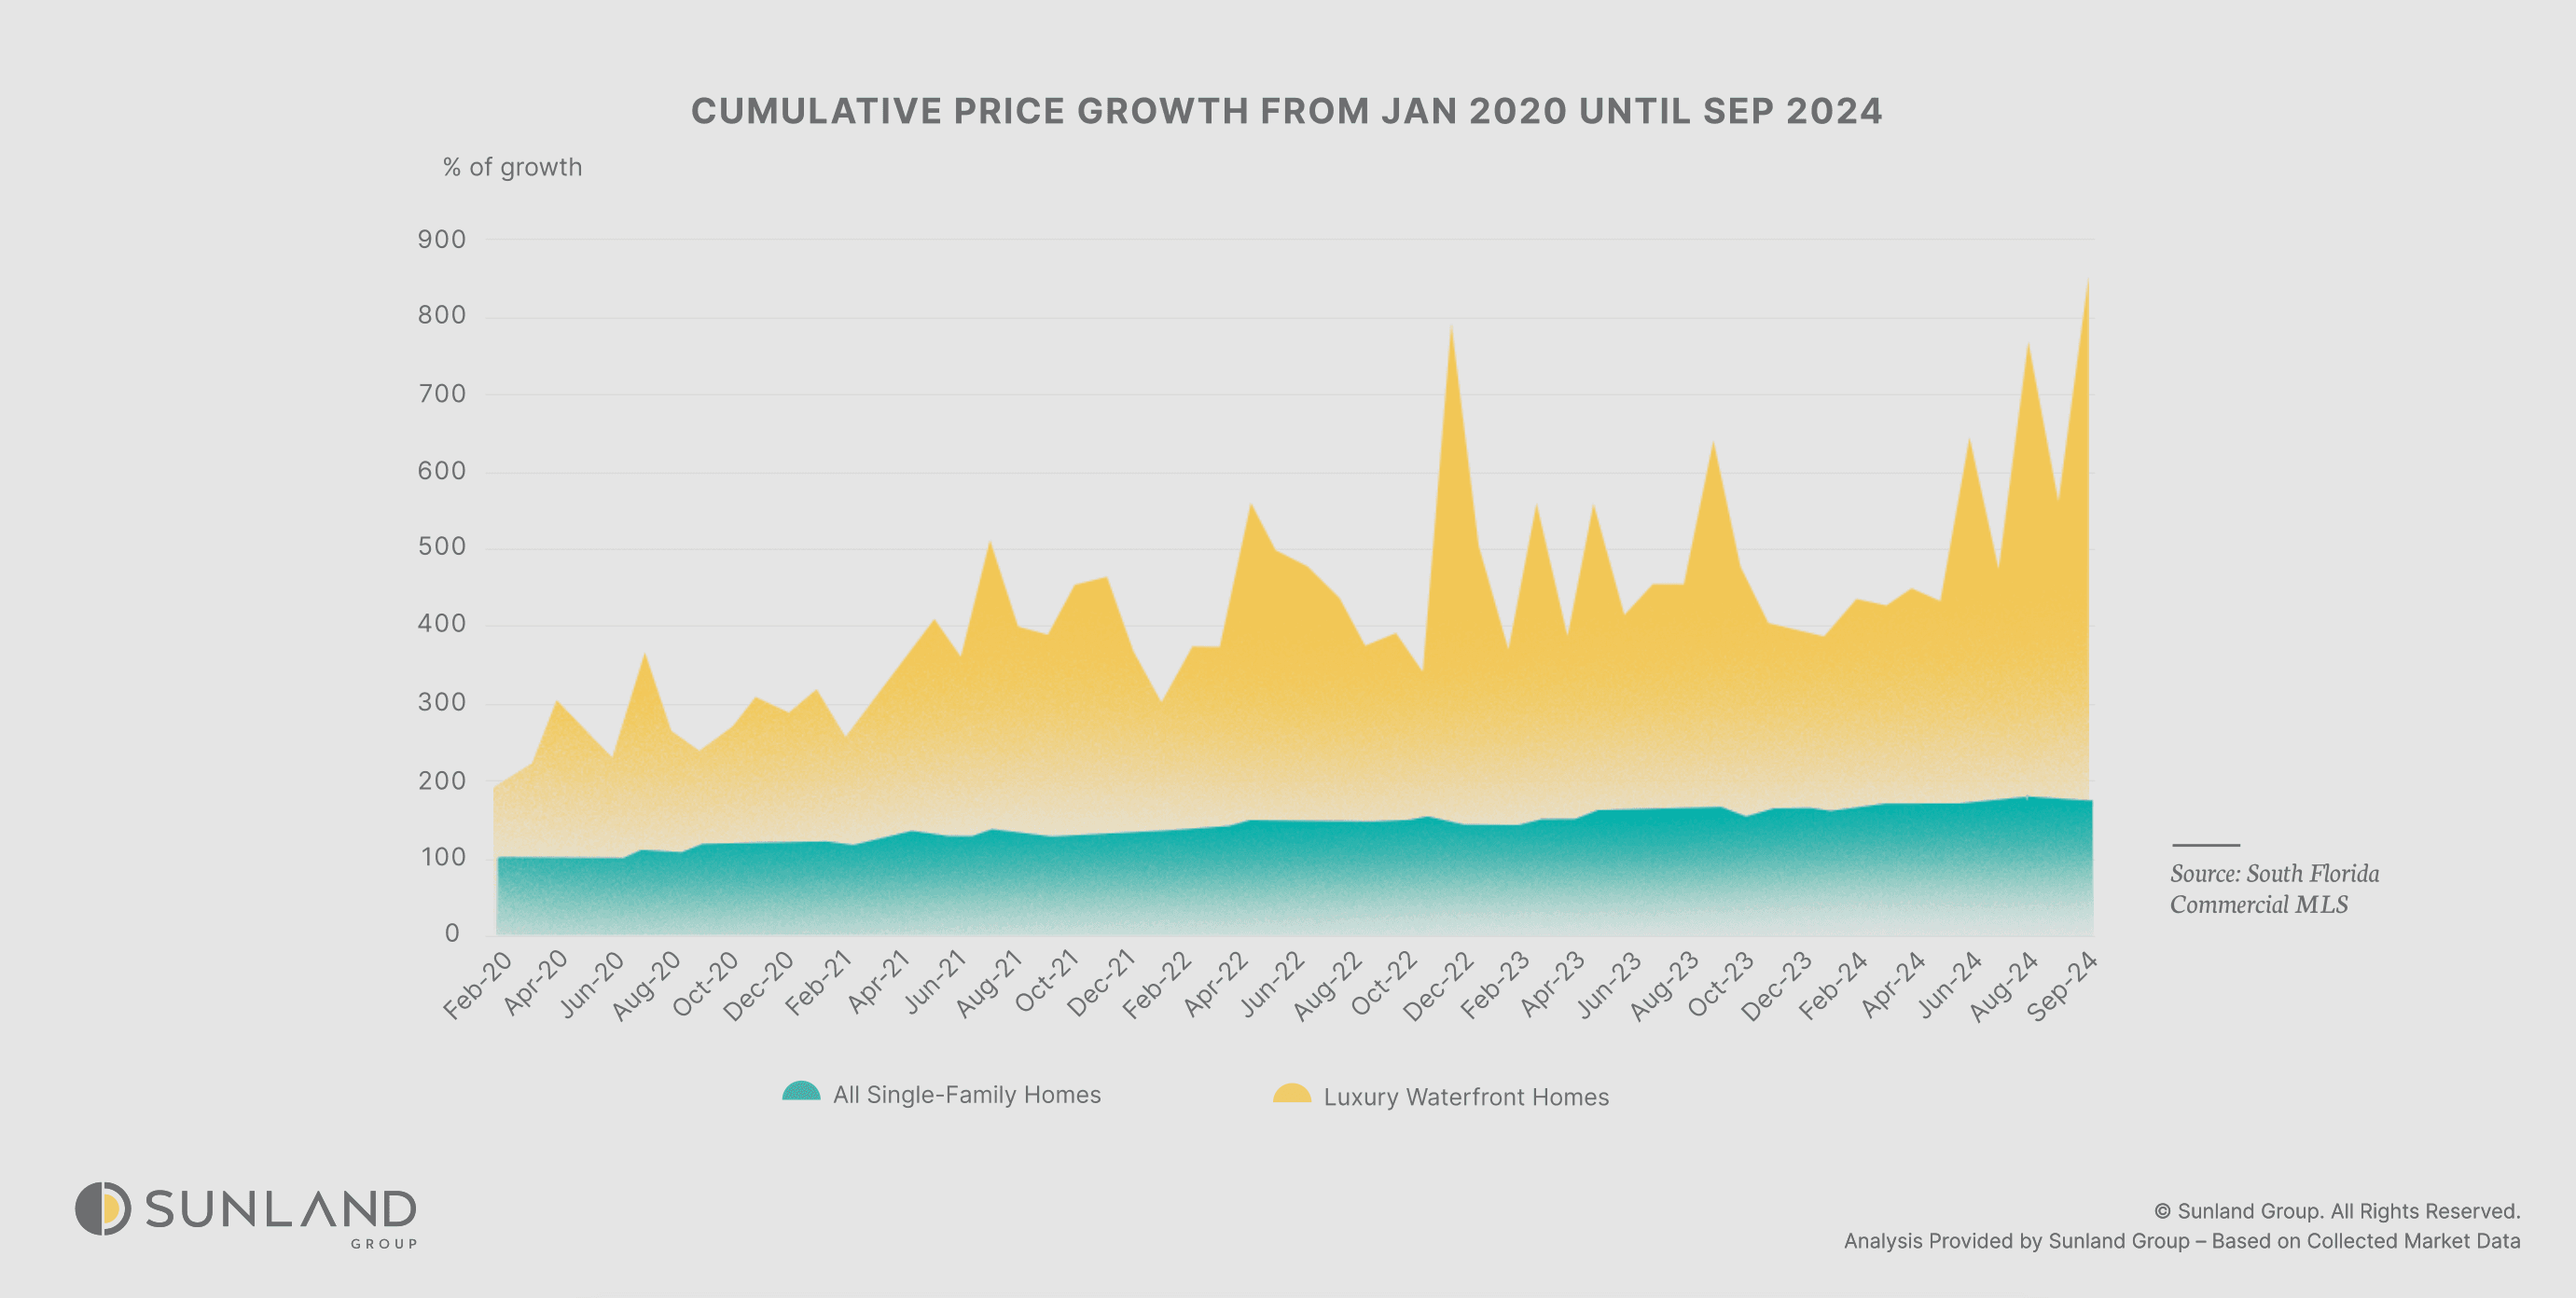
Luxury real estate has traditionally been viewed as a stable asset, with prices holding their value and experiencing modest increases that align with or slightly outpace inflation. However, the pandemic marked a significant shift, particularly in the waterfront property market. A surge in demand for these premium homes drove a consistent upward trend in prices, underscoring their exceptional value. With the county’s average price per square foot at $485, waterfront properties far exceed the broader market, highlighting their unique appeal and desirability.
CORAL GABLES PRICE DIP: A CLOSER LOOK
In 2023, Coral Gables experienced a notable decline in prices. This dip likely reflects a temporary market adjustment rather than a true loss of value, as the area continues to command a premium due to its exclusivity and desirability.
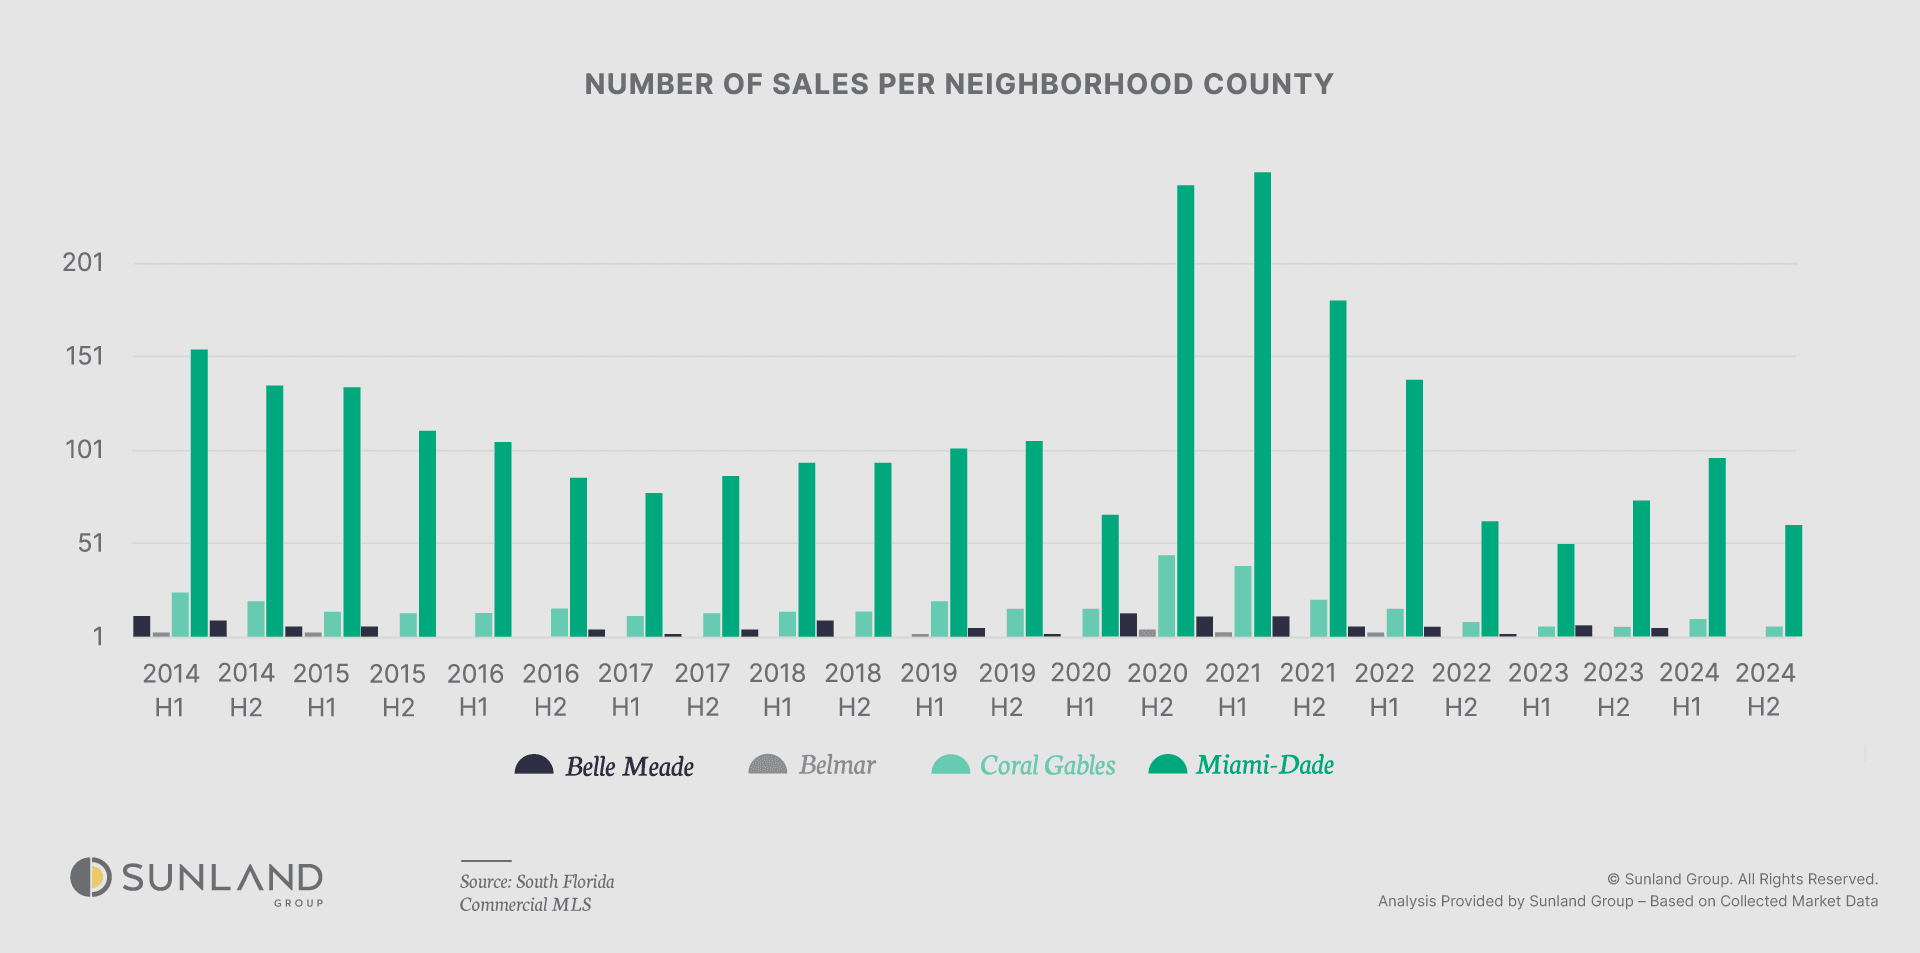
To better understand this price trend, we can examine the sales chart, which highlights how demand has shifted. A thinning sales count in Coral Gables likely contributed to the limited diversity in pricing, explaining the momentary dip. Despite this fluctuation, Coral Gables remains a centerpiece in Miami-Dade’s luxury real estate market.
SALES TRENDS
The sales graph highlights a dramatic shift in the market during 2021, when a surge in sales led to a record number of sales. This sudden activity was likely fueled by heightened demand for waterfront properties during the pandemic, as buyers prioritized more spacious and luxurious homes.
This spike in sales created a ripple effect: by 2022, the market experienced a much-needed cooling-off period as the heightened activity of 2021 diminished available inventory and allowed the market to stabilize. This decline in sales volume provides an essential context for understanding the trends in subsequent years.
Interestingly, 2023 marked a record low in sales over the 10-year period, with just 126 sales. However, in 2024, the sales volume rebounded to approximately 160, indicating renewed activity in the market. While still below the 10-year average of 220 sales, the upward trend in prices throughout both halves of the year suggests continued momentum to the upside, reflecting sustained demand and confidence in the waterfront real estate market.
In this blog, we explored how to interpret historical pricing trends using the price per square foot metric and combined these insights with historical sales data to uncover patterns driven by the fundamental principles of supply and demand. In the next blog, we’ll shift our focus to a critical external factor influencing real estate: natural disasters. We’ll analyze how events like hurricanes, wildfires, and floods disrupt markets, alter buyer behavior, and reshape pricing trends from short-term volatility to long-term shifts in desirability. Join us as we explore the intersection of environmental risk and real estate economics.

ABOUT AUTHOR
Jaden Duxfield is a skilled Market Research Analyst at Sunland Group who brings a unique combination of strategic thinking and analytical expertise to the real estate industry. With a background in mechanical engineering and a degree from Auckland University of Technology, New Zealand, he offers a sharp understanding of the built environment. Jaden specializes in data-driven analysis to uncover emerging trends and guide investors and developers in making informed decisions. His proficiency in advanced statistics and Python programming is highlighted in his insightful blogs, where he transforms complex data into clear and actionable conclusions for industry professionals.
The information provided on this blog is for general informational purposes only and does not constitute financial, investment, or real estate advice. While I strive to present accurate and up-to-date information, the content may not reflect the latest market conditions or legal developments. Any reliance you place on such information is strictly at your own risk. Sunland Group and I do not make any representations or warranties regarding the accuracy, reliability, or completeness of the information provided.
Before making any financial or investment decisions, you should consult with a qualified professional who can provide advice tailored to your individual circumstances. Sunland Group and I will not be held liable for any losses or damages arising from the use of this blog or its content.
Blog
Explore our property blog for in-depth insights into residential and commercial market trends, lifestyle inspiration, expert advice and global real estate updates.
SUNLAND MARKET RESEARCH
Miami’s Luxury Condos Shifting Market Dynamics
SUNLAND MARKET RESEARCH
Introduction to Waterfront Properties Market

SUNLAND MARKET RESEARCH
Two different Hurricanes, two different stories

CORPORATE OFFICE
14 NE 1st Ave, Suite 305,
Miami FL 33132
PHONE NUMBER
(305) 209 1455