
Real and Nominal Prices within Miami’s Real Estate Market
Ever wondered why that ‘bargain’ home from a decade ago now feels like a million-dollar dream? It’s not just the market heating up, it’s inflation quietly reshaping what your money can buy. In real estate investing, understanding the difference between nominal and real home prices isn’t just a numbers game; it’s the key to spotting true value in a world where dollars don’t stretch like they used to. Buckle up as we dive into how inflation impacts your investments and why it’s the silent force every savvy investor needs to master.
INTRODUCTION
In this blog, we’ll explore how inflation shapes Miami’s 2025 housing market, where average listing prices reached a record $710,000, with an average year over year price change of 5.1%. By analyzing inflation data, we’ll break down the housing component of inflation to better understand the real returns on our investment property and identify periods when your property may have been losing value without even realizing it.
NATIONAL INFLATION AFFECTING MIAMI’S LISTING PRICES
Let’s begin by examining the current average listing prices in Miami and overlaying them with the year-over-year CPI change to visually explore the interaction between these two key metrics. Since we’re using national CPI values, we can observe a noticeable lag effect as the city of Miami slowly started to follow the national trend.
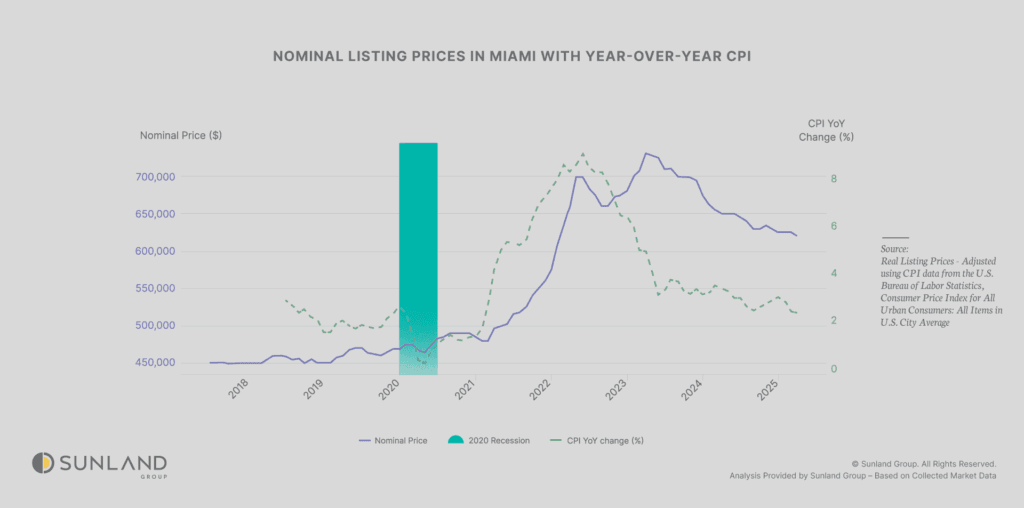
The chart above illustrates how, following the 2020 recession, inflation began to rise sharply, driving Miami’s housing market to follow suit with a dramatic price surge. Over just four years, average listing prices in Miami nearly doubled, climbing from approximately $450,000 in 2018 to a peak of $700,000 in 2022. Even as inflation began to correct in 2023, dropping to around 5% by year-end, the lagged effect of earlier inflationary pressures continued to fuel Miami’s market, pushing listing prices to a new record high of $710,000 by mid-2023. This disconnect highlights how inflation’s momentum sustained nominal price growth, though, as we’ll explore, real prices adjusted for inflation tell a different story, revealing a correction that has since brought values below their pre-inflation trend by May 2025.
HOUSING COMPONENT OF INFLATION
Within the CPI, a significant portion of around 40%, according to the Bureau of Labor Statistics, accounts for shelter costs, which encompass housing-related expenses like rent and owners’ equivalent rent. This substantial share highlights housing’s critical role in driving inflation, particularly when examining year-over-year changes that reflect broader economic trends in Miami’s 2025 housing market.
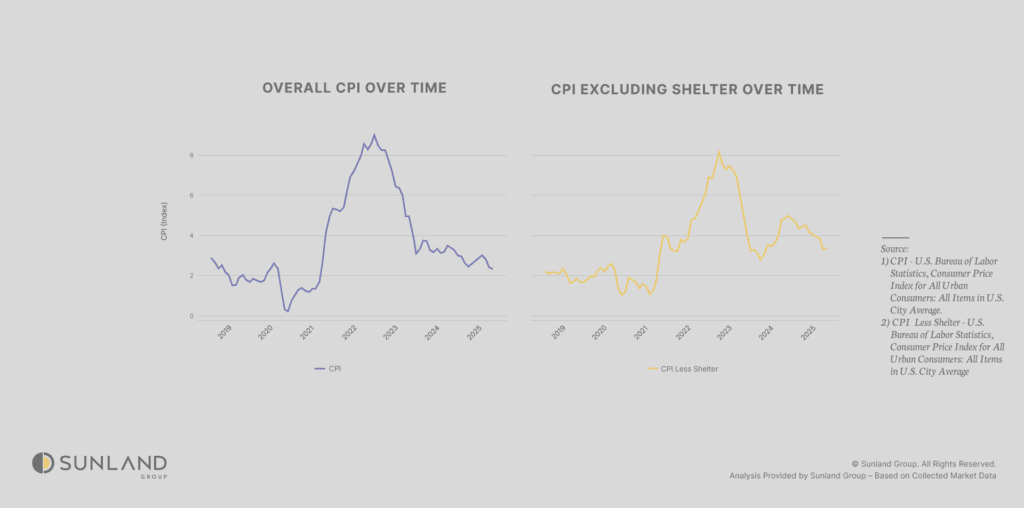
To further isolate the housing component’s role in inflation, we plot the spread between the year-over-year percentage changes of overall CPI and CPI less shelter. A positive spread indicates that housing inflation is outpacing non-housing inflation, while a negative spread suggests the opposite.
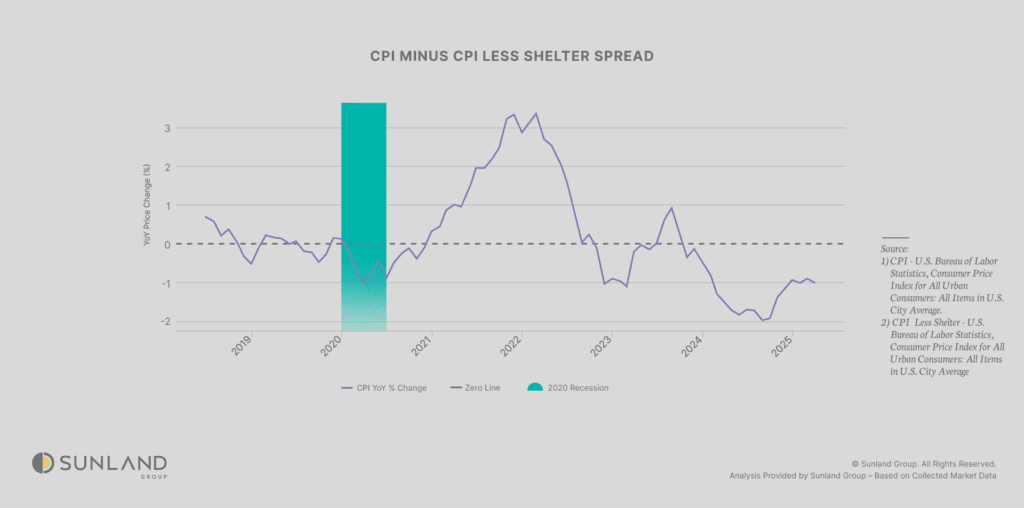
During the 2020 recession, constrained supply chains significantly increased the prices of goods and services, which meant that the housing component was not the dominant force driving inflation, as anticipated. However, beginning in 2021, as Miami’s house prices started to soar, the housing component of inflation experienced a sharp rise, reaching its peak in 2022. The spread between overall CPI and CPI less shelter hit its lowest point by the end of 2024, indicating a notable shift in inflationary dynamics. Since approximately the beginning of 2023, we have been in a negative spread, reflecting that the inflationary pressures from the food, energy, and service sectors have outpaced those from housing. However, since late 2024, the housing component has shown signs of strengthening, suggesting that it is regaining influence.
NOMINAL VS REAL HOME PRICES
Another key application of the CPI is its ability to measure the true value of a property by adjusting nominal prices to account for inflation. By converting nominal prices, the raw, unadjusted figures into real prices using CPI data, we can determine the actual value of our property after factoring out the effects of inflation. This process reveals how much value our investment has retained or gained in real terms, offering a clearer picture of its performance over time in Miami’s dynamic housing market. In this section, we’ll dive into the distinction between nominal and real home prices to better understand the genuine returns on our property amidst inflationary pressures.

The chart above illustrates the nominal and real listing prices in Miami from 2016 to 2025, with real prices adjusted using overall CPI to reflect 2020 dollars. While nominal prices have soared to $710,000 in 2023, real prices tell a different story. During the 2020 recession, both nominal and real prices stagnated, but as inflation peaked at 8.9% in 2023, real prices may have dipped, showing a loss in value despite nominal gains. By 2025, with inflation cooling to 2.3%, the real price increase of 2.8% (5.1% – 2.3%) indicates a modest gain in true value, though still below the nominal growth rate. This analysis highlights how inflation can mask the real performance of our investment property, revealing periods of hidden value loss in Miami’s volatile market.
REMOVING THE HIGH INFLATIONARY COMPONENT
After navigating a period of high inflation that saw prices skyrocket, Miami’s housing market has undergone a significant shift. Real listing prices, which peaked in 2022 amidst an inflationary surge that saw CPI reach 8.9% in 2023, have been steadily declining since then, reflecting a cooling market. To understand where prices stand today, we can look at the trend from 2019 to mid-2021, a period before the inflationary wave, and then, draw a trend line to estimate where real listing prices would have likely been without that disruption.
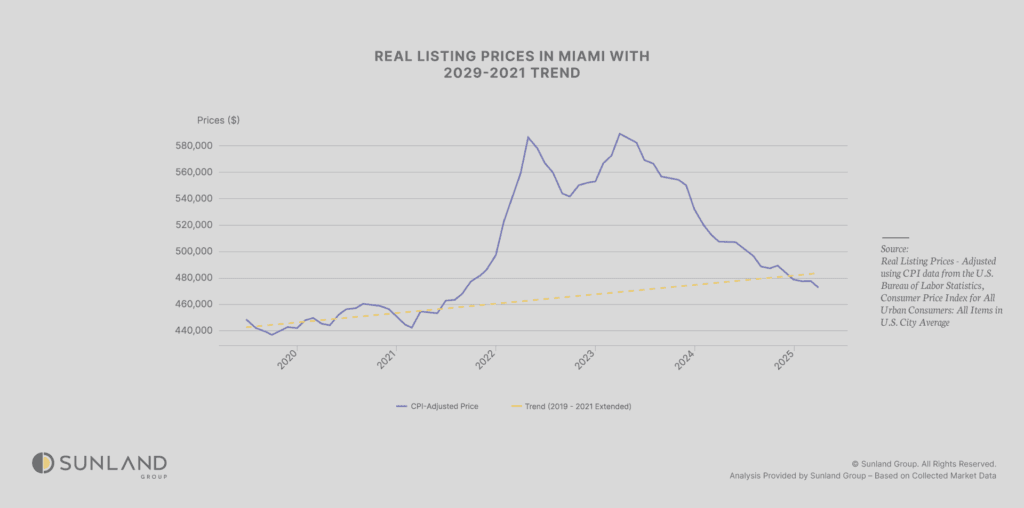
The chart above shows that by May 2025, real listing prices have not only returned to this pre-inflation trend but have fallen below it, indicating that homes in Miami are now undervalued relative to pre-COVID expectations. This suggests that the inflation-driven price surge has been fully unwound in real terms, and current prices are lower than where they would have been had the market followed its pre-2020 growth trajectory, presenting a potential opportunity for buyers.
CONCLUSION
In analyzing Miami’s 2025 housing market, we’ve uncovered critical insights into the interplay between inflation, listing prices, and the true value of properties. To gain a clearer picture, we’ve employed two key analyses: calculating real listing prices by adjusting for overall CPI and examining the spread between the year-over-year changes of overall CPI and CPI less shelter. The real price analysis, which adjusts nominal prices to account for inflation, reveals that by May 2025, real listing prices have fallen below the 2019–mid-2021 trend, indicating that homes in Miami are currently undervalued relative to pre-COVID expectations, a potential opportunity for investors or buyers. Meanwhile, the spread analysis isolates housing’s role in inflation, showing a shift from housing-driven inflation in the 2021–2023 expansion (with a positive spread) to non-housing dominance in the 2023–2024 slowdown (negative spread), and now a trend toward a zero or positive spread, suggesting housing inflation may rise again. By using these tools, investors and homeowners can better assess the real returns on their properties, identify periods of hidden value loss, and make informed decisions in Miami’s dynamic and ever-evolving housing market.

ABOUT AUTHOR
Jaden Duxfield is a skilled Market Research Analyst at Sunland Group who brings a unique combination of strategic thinking and analytical expertise to the real estate industry. With a background in mechanical engineering and a degree from Auckland University of Technology, New Zealand, he offers a sharp understanding of the built environment. Jaden specializes in data-driven analysis to uncover emerging trends and guide investors and developers in making informed decisions. His proficiency in advanced statistics and Python programming is highlighted in his insightful blogs, where he transforms complex data into clear and actionable conclusions for industry professionals.
The information provided on this blog is for general informational purposes only and does not constitute financial, investment, or real estate advice. While I strive to present accurate and up-to-date information, the content may not reflect the latest market conditions or legal developments. Any reliance you place on such information is strictly at your own risk. Sunland Group and I do not make any representations or warranties regarding the accuracy, reliability, or completeness of the information provided.
Before making any financial or investment decisions, you should consult with a qualified professional who can provide advice tailored to your individual circumstances. Sunland Group and I will not be held liable for any losses or damages arising from the use of this blog or its content.
Blog
Explore our property blog for in-depth insights into residential and commercial market trends, lifestyle inspiration, expert advice and global real estate updates.
SUNLAND MARKET RESEARCH
Tariffs: Impact on the New Construction Housing Market
SUNLAND MARKET RESEARCH
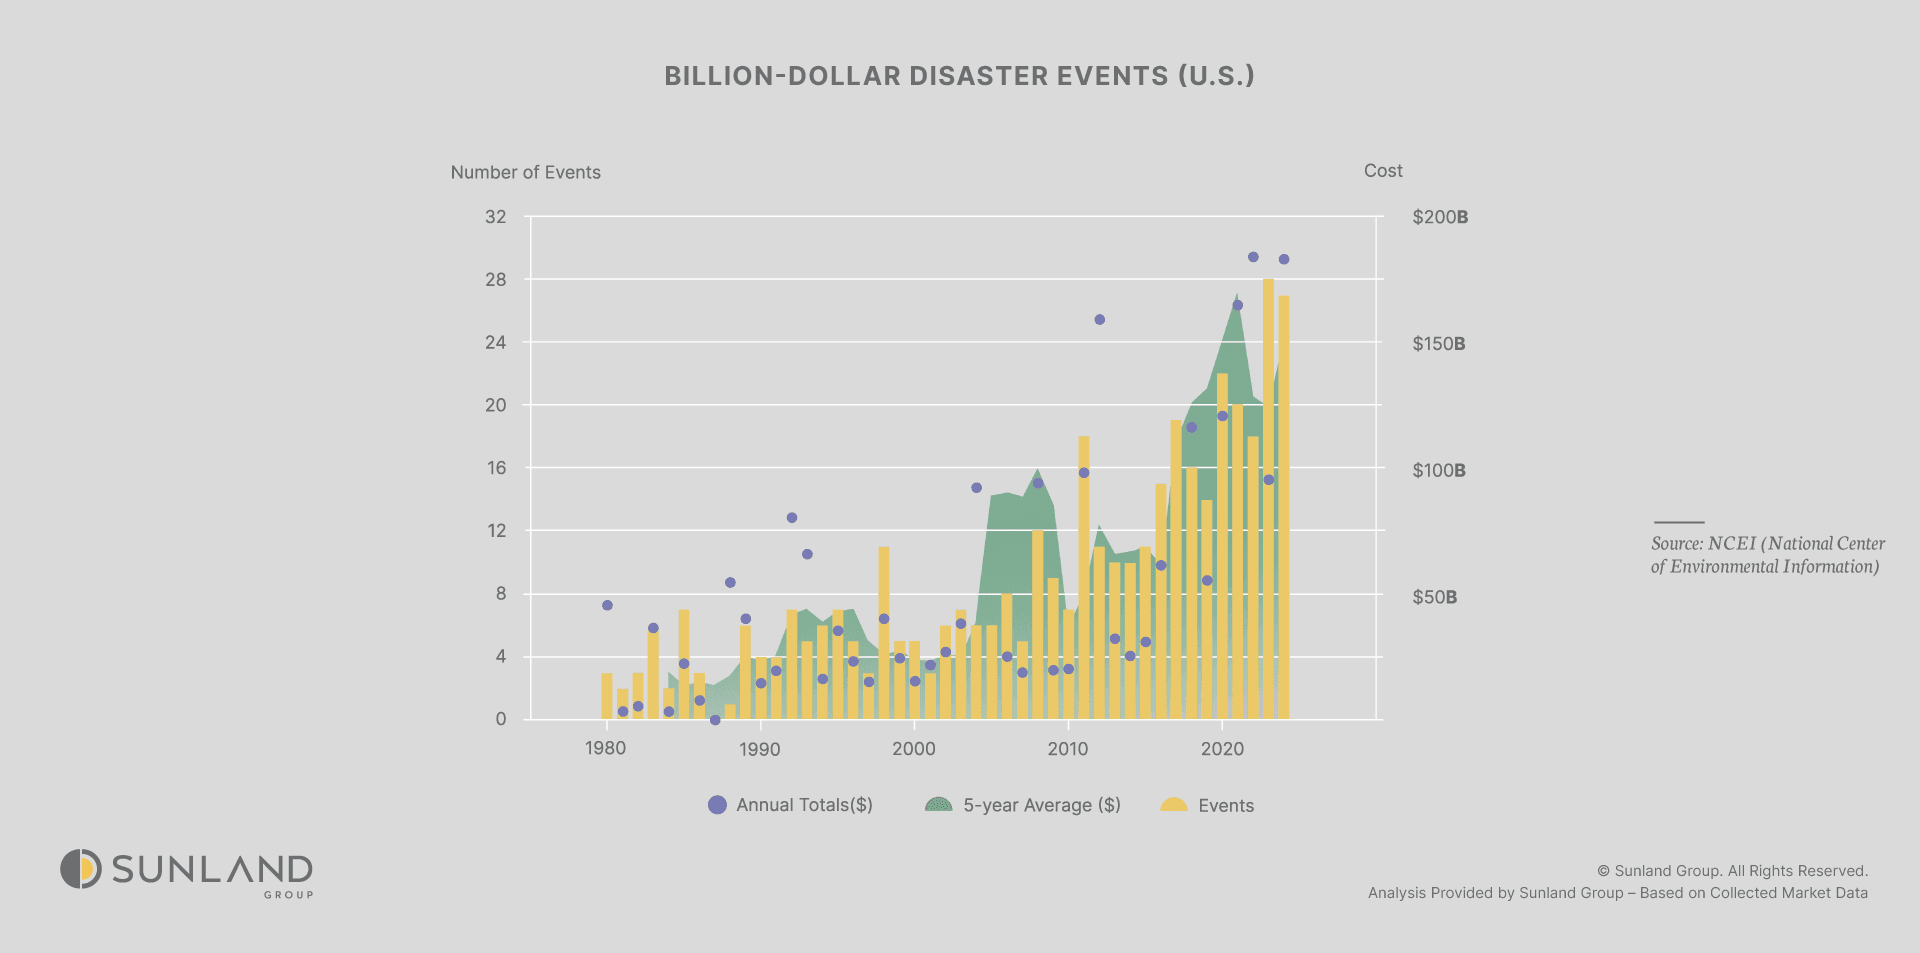
Adapting to change: How natural disasters shape better building practices

SUNLAND MARKET RESEARCH
Two different Hurricanes, two different stories

CORPORATE OFFICE
14 NE 1st Ave, Suite 305,
Miami FL 33132
PHONE NUMBER
(305) 209 1455