

How building age splits Downtown Miami condo prices
Downtown Miami from Biscayne Bay. Newer towers command a multiple of the price per square foot paid for pre-1980 stock, and they also account for most of the unsold inventory.
Downtown Miami is not one condo market. It is two markets stacked on the same waterfront: a slower-moving older book that still clears near list at modest prices, and a newer book that prices like branded hospitality product even as listings pile up. The gap between those two books is the story of 2026.
Over the trailing 365 days, the Downtown area (ZIPs 33130, 33131, 33132, and 33137, plus the broader listing set feeding this snapshot) shows 5,250 active for-sale condo and condo-townhome listings, 535 pending contracts, and 2,937 closed sales. Median list price sits at $500,000. Median sold price is $375,000. That $125,000 spread is the first signal that asking prices and clearing prices have drifted apart.
SALE-TO-LIST RATIO
Downtown Miami condo snapshot, trailing 365 days. Months of supply based on 244.9 sales per month.
A saturated core, not a frozen one.
Saturation here is real, but it is not uniform. Market-wide months of supply stand at 21.44. Pending listings are only 9.25 percent of the active book. That is a buyer’s market by any conventional definition — balanced markets typically sit closer to six to nine months.
The core Downtown ZIPs are even heavier:
- 33132 — 35.47 months of supply
- 33130 — 31.3 months
- 33131 — 27.1 months
- 33137 — 24.34 months
County-wide existing-condo supply has been closer to 12 months in mid-2026 reporting from the Miami Association of Realtors, with inventory actually declining year over year even as Downtown remains the softest urban node. The distinction matters. Miami-Dade as a whole is working through product. Downtown is working through a pipeline that arrived faster than end-user demand.
The 2020-and-newer cohort makes the imbalance plain: 1,015 active listings against only 215 sales in the past year. Older stock turns over more steadily. Pre-1980 buildings show 1,087 for-sale and 811 sold. The 1980–1999 group shows 797 for-sale and 714 sold. Velocity, not just price, is age-dependent.
BUILDING AGE IS THE PRICE MACHINE
Price per square foot is where the split becomes impossible to miss. Overall sold PPS in this snapshot is $400.50. That average hides a four-fold range.
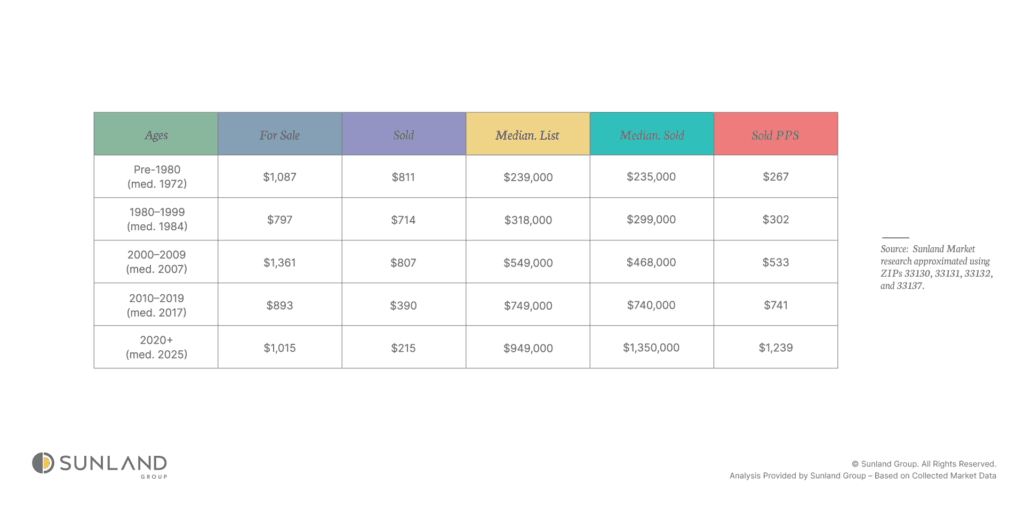
Newer buildings command two to four times the price per square foot of pre-1980 stock. That is not a small quality premium. It is a different product class: updated mechanicals, hospitality-grade amenities, stronger reserve profiles on paper, and marketing that prices the building as much as the unit.
List-to-sold behavior follows the same split. Market-wide median sale-to-list is 0.955. The 2010–2019 cohort is tight: median list $749,000 versus median sold $740,000. Pre-1980 trades almost at list — $239,000 asking, $235,000 sold — because the absolute price is already discounted. The 2020+ cohort is the outlier: median list $949,000, yet closed deals in the set show a median sold of $1.35 million. That does not mean every new tower is selling above ask. It means the deals that do close are concentrated in the better lines, branded residences, and sponsor inventory that still finds a qualified buyer, while a large unsold remainder sits at ambitious asking prices.
WHY OLDER BUILDINGS LOOK CHEAP — AND WHY THEY OFTEN ARE NOT
The 2021 collapse of Champlain Towers South in Surfside reset underwriting for every Florida condominium. Statewide reforms (including milestone inspections and non-waivable reserve funding) raised carrying costs on buildings that deferred maintenance for decades. Insurance, special assessments, and rising HOA dues are now part of the bid, even when they do not appear in listing-level data.
That is why a $235,000 median sale in a 1972 building can be a more expensive ownership experience than a $740,000 sale in a 2017 tower. Entry price is not total cost of ownership. Buyers in the older cohorts must underwrite reserves, structural reports, and insurance independently. Lenders already do.
Where Downtown actually trades.
Core ZIPs concentrate newer inventory. Median year built runs from 2008 in 33131 to 2018 in 33132 and 33137. Pricing sits well above the overall $375,000 median sold and $400.50 sold PPS:
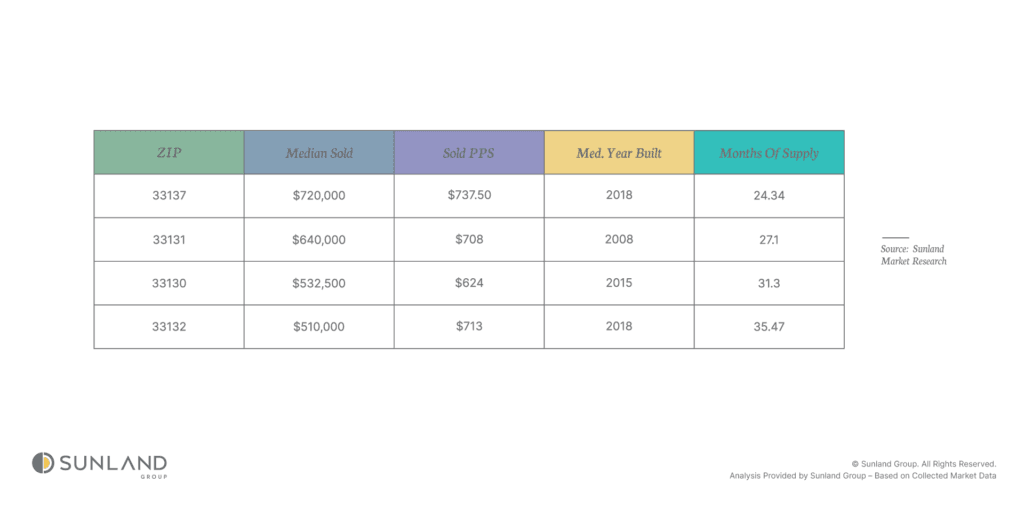
33131 and 33137 show relatively stronger price realization than 33132, which carries the heaviest supply. Peripheral older ZIPs such as 33179 (median year built 1969, PPS $179) and 33172 (1975, PPS $269) are different submarkets — less walkable, fewer amenities, and not substitutes for the core.
THE AIRBNB QUESTION: YIELD IS NOT A FLOOR PLAN
A large share of Downtown’s unsold book was originally underwritten as an investment condo: park it, list it on a short-term platform, and let tourism pay the note. That thesis is weaker in 2026 than it was in 2021, and the reasons are structural rather than seasonal.
MOST RESIDENTIAL TOWERS ARE NOT HOTELS
Florida does not ban short-term rentals statewide. What it does is leave the decisive veto with the building. Under Florida Statute 718.110(13), a condominium association can amend its declaration to restrict rental duration or frequency; those amendments bind owners who consent and anyone who buys after the amendment. In practice, the majority of conventional Downtown residential associations either prohibit stays under 30 days, require six-month minimums, or demand board approval that is rarely granted for nightly use.
The units that can legally operate as Airbnbs tend to sit in a narrower set: hotel-zoned condo-hotels and a minority of buildings whose documents still allow short stays. Purpose-built condo-hotels in Brickell, Edgewater, and Miami Beach are a different asset class. They come with operator programs, higher HOA and hotel assessments, and pricing that already capitalizes the rental right. Buying a standard residential unit and assuming nightly income is the error that still shows up in listing remarks.
FOUR LAYERS OF PERMISSION, NOT ONE
Even where the association allows it, a Downtown short-term rental has to clear a stack of public rules. The State of Florida requires a DBPR vacation-rental license once a unit is rented more than three times a year for stays under 30 days. Miami-Dade requires a Certificate of Use before the listing goes live, plus a local business tax receipt and monthly remittance of convention and tourist development taxes. The City of Miami adds zoning under Miami 21: lodging use is generally viable in T4, T5, T6, and certain mixed-use transects, and generally not in low-density residential zones. Combined state and county lodging taxes run about 12 to 13 percent.
Occupancy caps (typically two people per bedroom plus two, with a hard ceiling of 12) and responsible-party rules further limit the “party apartment” model that some investors still underwrite from 2019 pitch decks. Fines for unlicensed operation are material. The association letter is often the document that kills the application.
WHY THIS MATTERS FOR TODAY’S INVENTORY
Saturation in the 2020+ cohort is not only a story about too many towers. It is also a story about a business model that no longer pencils at asking prices. Analysts tracking Greater Downtown have noted that modern product is still being listed as if a tourism-led bidding wave were intact, while closed prices and rent-based valuations sit well below those asks. When carrying costs — mortgage rates in the mid- to high-6 percent range, insurance, HOA, and taxes — meet restricted rental rights, the investor bid steps aside. What remains is the end-user bid, and there are not enough end users to absorb 1,015 new-cohort listings in a year.
Event calendars (including the 2026 World Cup cycle) can lift nightly rates for the buildings that are already licensed and association-approved. They do not rewrite declarations, recertification timelines, or reserve studies. A two-week spike does not refinance a five-year absorption problem.
There is a legitimate Airbnb strategy in Miami. It is concentrated, licensed, and building-specific: condo-hotel inventory with documented short-stay rights, professional management, and a purchase price that works after tax, platform fees, vacancy, and furnishing. It is not “any Downtown one-bedroom with a bay glimpse.” Treating those as interchangeable is how investors become involuntary long-term holders in a 21-month supply market.
THE BACKDROP: RATES, PRICES, AND A TWO-SPEED COUNTY
The S&P Cotality Case-Shiller Miami home-price index was up 2.29 percent year over year as of June 2026 — modest appreciation at the metro level after the post-pandemic surge. That index blends houses and condos. On the ground, the two products have diverged. Through mid-2026, Miami-Dade single-family homes remained in relatively tight supply (near five months) with prices still ahead of the prior year, while existing condos carried roughly 12 months of supply and softer year-over-year medians. Downtown sits on the heavy side of that condo ledger.
Thirty-year fixed mortgage rates in Florida are clustered in the mid- to high-6 percent range as of early September 2026. Combined with 21 to 35 months of supply in the core ZIPs, that rate environment favors buyers who can underwrite the building, not just the unit. Newer towers carry higher but more predictable HOA costs tied to amenities and reserves. Older Florida condos often carry less predictable insurance and assessment risk. Listing data cannot quantify either line item. Both belong in every offer.
HOW TO USE THIS MARKET
Current conditions favor prepared buyers. They do not favor indiscriminate discount hunting. The useful distinctions are specific:
- Pay for age and reserves, not just a view. Post-2005 buildings deliver a clear PPS premium and tighter list-to-sold spreads, but only if the association’s reserve study and insurance program support the price.
- Treat 2010–2019 product in 33131 and 33137 as the most balanced core slice: strong price realization, high but less extreme supply than 33132.
- Approach 2020+ inventory with a closing-price mindset, not a list-price mindset. One thousand-plus actives against 215 sales is absorption risk, not a rounding error.
- Do not underwrite short-term rental income unless the declaration, zoning, Certificate of Use path, and tax stack are already confirmed in writing.
- Older, cheaper buildings can be rational purchases at the right basis — after structural, reserve, and insurance review, not before.
The skyline will keep adding glass. The buyers who do well in this chapter will be the ones who can tell which tower is a residence, which is a hotel in disguise, and which is an unfinished investment thesis listed as a lifestyle.

ABOUT AUTHOR
Jaden Duxfield is a skilled Market Research Analyst at Sunland Group who brings a unique combination of strategic thinking and analytical expertise to the real estate industry. With a background in mechanical engineering and a degree from Auckland University of Technology, New Zealand, he offers a sharp understanding of the built environment. Jaden specializes in data-driven analysis to uncover emerging trends and guide investors and developers in making informed decisions. His proficiency in advanced statistics and Python programming is highlighted in his insightful blogs, where he transforms complex data into clear and actionable conclusions for industry professionals.
The information provided on this blog is for general informational purposes only and does not constitute financial, investment, or real estate advice. While I strive to present accurate and up-to-date information, the content may not reflect the latest market conditions or legal developments. Any reliance you place on such information is strictly at your own risk. Sunland Group and I do not make any representations or warranties regarding the accuracy, reliability, or completeness of the information provided.
Before making any financial or investment decisions, you should consult with a qualified professional who can provide advice tailored to your individual circumstances. Sunland Group and I will not be held liable for any losses or damages arising from the use of this blog or its content.
Blog
Explore our property blog for in-depth insights into residential and commercial market trends, lifestyle inspiration, expert advice and global real estate updates.
SUNLAND MARKET RESEARCH
Lehigh Acres: Prime time to buy and build your dream home
SUNLAND MARKET RESEARCH
The Crown Jewel of South West Florida
SUNLAND MARKET RESEARCH
Miami’s Waterfront Gems: Single-Family Homes Riding High Amid Migration Madness

CORPORATE OFFICE
14 NE 1st Ave, Suite 305,
Miami FL 33132
PHONE NUMBER
(305) 209 1455